WAVE ATLAS
Technical Criteria Atlas
To develop a ready reference for pre-engineering design of coastal infrastructure and coastal protection along the coast of India, providing seasonal extreme value estimates of hydrodynamic loads in the form of wave, current and water levels at 10 locations, for different return periods such as 5,10,25,50 and 100 years.
North Indian Ocean Hindcast Model (1998 to 2012)
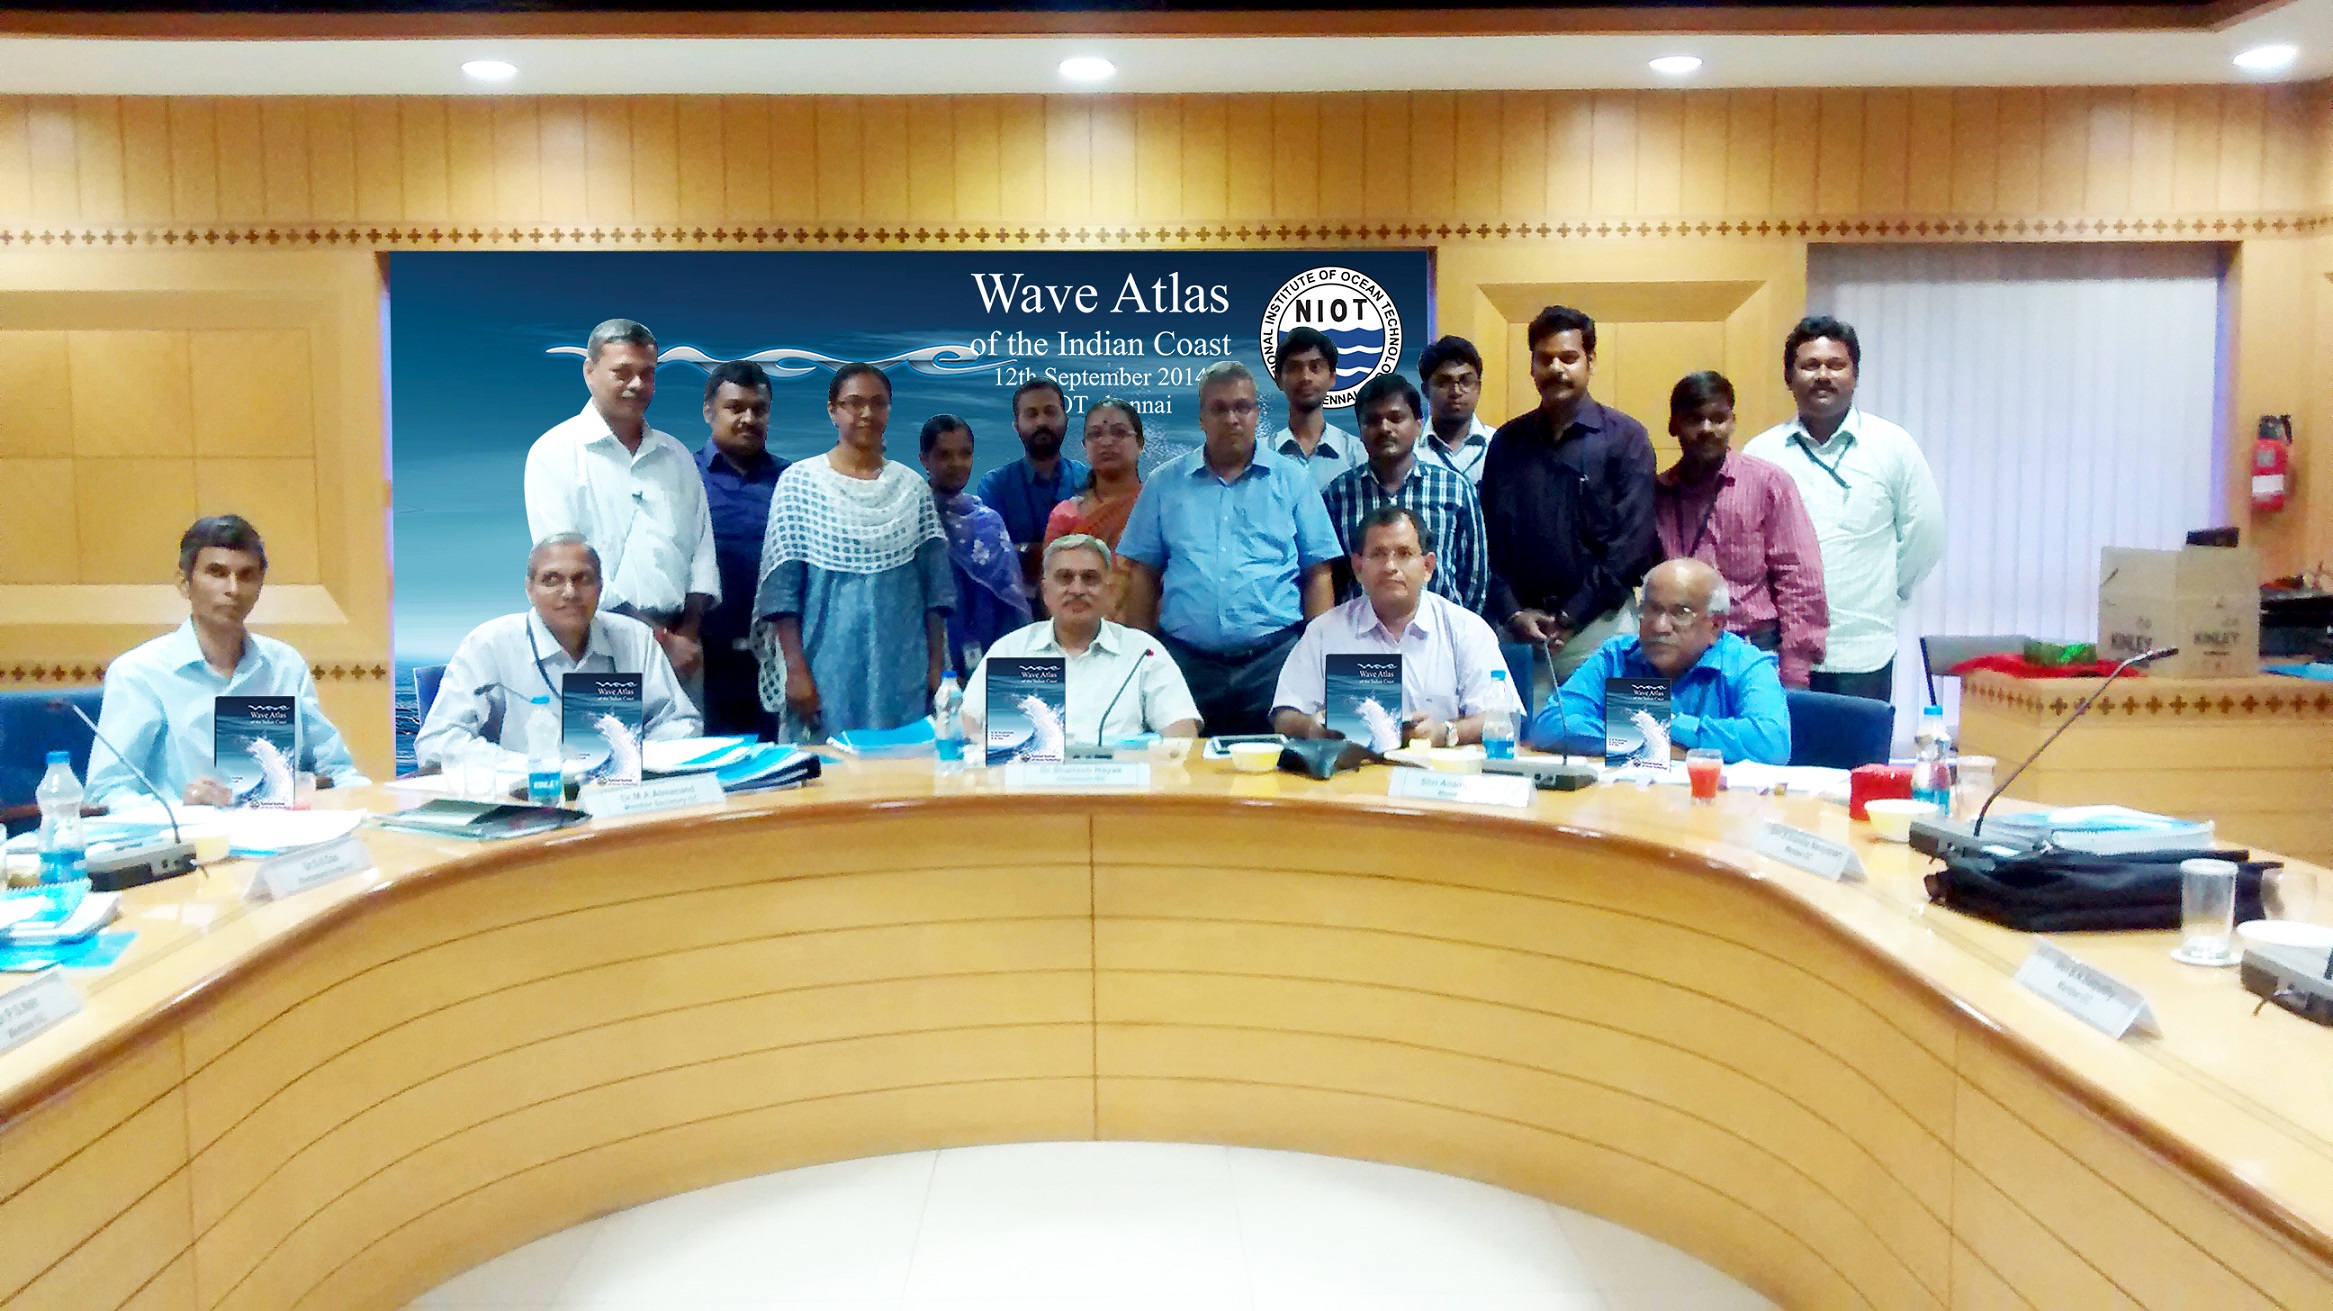
WAVE ATLAS hard copy released on Sep-2014

Move cursor over zones for selection

Move cursor over zones for selection
Move cursor over Text for map

Move cursor over Text for map

Move cursor over Text for map

Move cursor over Text for map

Move cursor over Text for map

Move cursor over Text for map

Move cursor over Text for map

INTRODUCTION
Accurate wave information is vital to many coastal and offshore activities and describes ocean-state in general. Waves play an important role in design criteria of coastal and offshore structures. Describing the characteristics and variability of wave requires long term observations with sufficient spatial and temporal resolution. In general the availability of measured wave data is very sparse and may not cover the various meteorological conditions (seasonal and inter-annual variability, cyclones etc.) and is limited to specific locations.
Though location specific wave climate is a significant input in coastal and offshore developmental activities, in developing countries like India it is difficult to obtain at the preliminary stage of a project for planning. Absence of readily available information demands site specific measurements and numerical modeling which is expensive as well as time consuming task. Wave climatology is prepared globally by many researchers using voluntary ship observations, simulated data, satellite altimetry, wave measurements etc (Young and Holland, 1996; Barstow et.al., 200; Sterl and Caires, 2005 and Taebi et.al, 2008). However many of these data sets does not cover Indian seas or less accurate along the Indian coast. The wave atlas of the North Indian Ocean was prepared using voluntary ship observations and measured data by NIO, Goa (Chandramohan et. al., 1991). Vethamony et. al. (2000) prepared wave climatology using simulated data and Geosat observations. NIO Wave Atlas lacks uniform data set and the reliability is limited due to visual observation. The wave climatology prepared using Geosat observations is based on short duration (4 years data) and may not suite the studies which require long term statistics. The wave information along the Indian coast with sufficient spatio-temporal resolution and duration can help in the planning stage of many coastal activities.
Considering the wide gap in readily-available-wave information for planning purposes of coastal developmental activities, ESSO-NIOT initiated the project towards developing a ready reference for wave as part of the ongoing project Technical Criteria Atlas. The uniform space‑time coverage of numerical model results for sufficiently long period is essential for preparing the wave atlas.
The present study is carried out utilizing the 15 year wave data simulated using MIKE21 spectral wave model developed by Danish Hydraulic Institute (DHI), Denmark. The model wind forcing is provided using ECMWF (European Centre for Medium-Range Weather Forecasting) operational archive wind data for the period 1998 to 2012. The wind vectors are available at every six hour with a variable resolution of 0.5 degree to 0.125degree (Long: 0 to 120degE, Lat: 70degS to 30degN). The wave measurements available at various depths in North Indian Ocean is utilised to validate model results. This report provides the details of the model setup, calibration and validation exercises carried out and the methodology and presentation of wave characteristics at selected locations in the North Indian Ocean.
An online version of wave atlas with query based data/data products retrieval is also available for users with advanced requirement. The hard copy provides few basic wave parameters at predetermined locations along Indian coast, whereas the online version provides data over a larger domain with facility to retrieve required information at user defined location. The online version presents the wave parameters and data statistics over the area covering long: 65-90oE, lat: 0-25oN at 0.1x0.1 degree grid at every six hours. The user can extract wave information related to a specific location as well as the data over the entire area. The online user can select location, period, parameter, data statistics etc. for display as graphs/data tables. The facility for detailed report at selected locations can also be provided on user request.
The Wave Atlas of the North Indian Oceans provides a ready-to-use database on various wave parameters. It is hoped that this publication will find a wide range of applications in engineering, research, recreational and shipping activities.
WAVE HINDCASTING FOR ATLAS
The wave model used for this study is MIKE 21 Spectral Wave Model (Mike21-SW) developed by the Danish Hydraulic Institute, Denmark. It is a third generation spectral wind-wave model based on unstructured meshes. The model simulates the growth, decay and transformation of wind-generated waves and swells in offshore and coastal areas. The model includes wave growth by action of wind, non-linear wave-wave interaction, wave-current interaction, refraction and shoaling. The dissipation due to white-capping, bottom friction and depth-induced wave breaking are also included. The model is based on the wave action balance equation where the wave field is represented by the wave action density spectrum. The details of the model equations and methods of solution are explained in MIKE21 user manual (2011).
CALIBRATION OF THE NUMERICAL MODEL
The existing third generation wave models have proven reliability in generating satisfactory results for various applications.. It is observed that the quality of the wind input and accurate shallow water bathymetry are the major deciding factors of the model results. The selection of the appropriate model domain, grid resolution and model calibration parameters also play a significant role in the quality of the simulated data.
WIND FORCING
The quality of the simulated wave data heavily depends on the quality of the wind input. Hence many wind datasets from various sources were utilized and results were compared. The freely downloadable data sets NCDC (National Climatic Data centre, USA) blended sea winds and NCEP/QSCAT blended ocean winds were utilized for simulating the wave parameters. NCDC Blended Sea winds are available at 0.25 x 0.25degree grid at every six hour interval since July 1987 (Zhang, et. al., 2006). Even though the temporal and spatial resolution of NCDC wind data is good and is available for long period, gaps in data are observed which reflected in simulated results and hence discarded. QSCAT/NCEP Blended ocean winds are available at 0.5x0.5degree grid at every six hour interval from July 1999 to July 2009 (Chin et. al., 1998). The NCEP/QSCAT data provided a good simulated results but the data set is available only for a limited period and hence could not be utilized for the present study. ECMWF analysed wind from operational archive is available with a variable grid at every six hour interval since August 1982. These data sets are produced at ECMWF as part of various global analyses and forecasts and archived in MARS (Meteorological Archival and Retrieval System). The resolution and internal representation of the archive varies according to changes in data assimilation and forecast system in operational use at ECMWF. The ECMWF wind during the period January 1998 to December 2012 (Table 1) are used as wind input for wave hindcasting in this work and were validated with field observations
Table 1: The resolution of ECMWF wind data used for the present study
|
Sl No. |
Spatial Resolution (Deg. Grid) |
Temporal Resolution (Hours) |
Period |
|
1 |
0.5 x 0.5 |
6hourly |
01 Jan1998 to 31st Jan 2006 |
|
2 |
0.25 x 0.25 |
6hourly |
01 Feb 2006 to 30 Jun 2012 |
|
3 |
0.125 x 0.125 |
6hourly |
01 Jul to 31 Dec 2012 |
Even though the ECMWF data is with non-homogenous spatial resolution, the availability for a longer period and the better agreement with measured data resulted in selecting the data set. Considering the scarcity of measured data for validating the input wind as well as simulated wave data, the period of hindcasting starts from 1998, as it also coincides with the establishment of moored buoy network in Indian Seas.
BATHYMETRY AND MODEL DOMAIN
The primary bathymetry data set used for the present project is ETOPO1 (Earth Topography 1-Minute) gridded elevation (land) and bathymetry (sea floor) data set. However the sensitivity analysis indicated better agreement when the coastal bathymetry is replaced with MIKE CMAP data. Consequently a combination of these data sets with CMAP data for water depth less than 250m in North Indian Ocean and ETOPO1 elsewhere is used to prepare the model bathymetry of the study area (Fig. 1). The coast line is prepared using the coastline extractor from the NOAA/National Geophysical Data Center (NGDC). The sensitivity analysis of spatio-temporal resolution and model domain is carried out to identify the optimum resolution and extent of model domain which are decisive factors in the model performance and time consumption. Considering the complex variation in bathymetry and demand for high resolution in the model, extensive sensitivity analysis is carried out. It is observed that inclusion of Gulf of Thailand and Java Sea significantly increases complexity and run time of the model without much contribution to the waves generated in North Indian Ocean. Hence the model domain is closed in the Malacca Strait. However the Red sea and Persian Gulf are included in the domain. The selection of southern boundary seems to be very sensitive and is fixed at -40deg (Longitude varying from 20 to 120degE) after extensive analysis. The south eastern boundary is closed at 120degE with Australia.
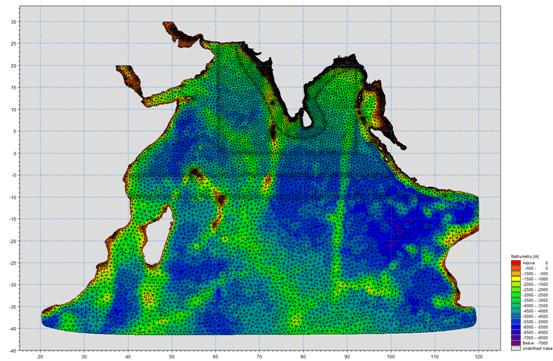
Fig. 1: The bathymetry used for wave hindcasting studies
The bathymetry is setup with a nested model domain with varying grid sizes which covers 40oS to 30oN over a longitudinal extent of 20 to 120oE. Bathymetry contours at 200m, 100m and 50m along the coastal belt with a fine resolution of 0.04, 0.02 and 0.01deg2 element area are utilized.
MODEL CALIBRATION PARAMETERS
The calibration parameters available with MIKE21-SW are spectral resolution, bottom friction, wave breaking parameters and white capping parameters. The model direction is resolved with 16 directions resulting in a resolution of 22.5degree. The logarithmic distribution of frequency is selected with a frequency factor of 1.1 with 27 frequencies. The wave period ranges from 2.1s to 25.0s (ie, frequencies from0.48 Hz to 0.04Hz). The calibration of the remaining model parameters are carried out with the corresponding values varying between a permissible range to minimize the difference with the measured data. The selection of a large model domain and the availability of non-homogenous validation points made it difficult to arrive at a uniform coefficient applicable for the entire domain. Hence the default values are utilized for the wave hindcasting.
VALIDATION OF MODEL RESULTS
The simulated wave characteristics using MIKE21-SW is validated using moored buoy data to assess the quality and reliability of the model. The comparison is carried out in deep as well as in shallow water in Arabian Sea and Bay of Bengal. It is observed that the simulated wave parameters in deep water are in good agreement with that of measured wave data and hence the report focuses on the validation carried out in shallow water locations only. The in-situ wave observations from ESSO-NIOT-Chennai, INCOIS-Hyderabad and NIO Goa are utilized to validate the model results.
IN-SITU BUOY OBSERVATIONS
The moored buoy network established by National Institute of Ocean Technology under the Ministry of Earth Sciences provided major source of the in-situ observations for validating the input wind and the simulated wave data. The buoy data is available at specific locations in the North Indian Ocean since 1998. Apart from the moored buoy observations, the wave data measured using Directional Wave Recorder (DWR) buoys by ESSO-NIOT as part of various other projects are also utilized in this project. The wave observational network of ESSO-INCOIS started in 2007 and presently operates a network of 10 wave rider buoys. The DWR-buoy measurements carried out by NIO-Goa during the reporting period is obtained and is utilized to validate the model results. Combining all available data, more than 25 buoy locations in coastal waters is utilized to validate the model results (Fig. 2).
Fig. 2: Location map of the buoy network used for validation of model results. The data from locations indicated with * symbol have been presented in this report
The NIOT moored data buoy is equipped with a MRU (Motion Reference Unit) for wave measurements. The MRU is an inertial attitude heading reference system with dynamic linear motion measurement capability, which outputs absolute Roll, Pitch and Yaw (Heading), and relative heave (Dynamics). The data is measured at a rate of 1 Hz for 17 minutes at every three hours. The processor on the buoy applies wave analysis software, which uses a Fast Fourier Transform on the wave record to obtain the power spectrum. Both directional and non-directional analysis was carried out to calculate a range of wave parameters. The DWR is capable of measuring wave periods up to 100s and unlimited wave height with 1cm resolution with ± 1cm or 0.1 percentage of value as its accuracy. The wave direction is reported from 0 to 360° with respect to north with 1.5° resolution. The data is recorded for 20 minutes duration at a frequency of 1.28Hz and the processed data is available at half/one hour interval.
VALIDATION
The significant wave height (Hs), average wave period (Tz) and mean wave direction (Mdir) are validated at all available locations. The seasonal variability and the sudden fluctuations are well captured in the model. The validation results of two locations, one in Arabian Sea (AS) and other in Bay of Bengal (BoB) are presented in this report. One year wave data collected off Vijayadurg at 17m water depth during October 2006 to September 2007 at an interval of one hour is presented as a typical case study in AS (Fig. 3). The Hs, Tz and Mdir could exhibit the seasonal variability and follows the trend in general including the high frequency fluctuations. It is observed that the Hs is in better agreement when the wave height is lesser (typically less than 2m) is a general trend observed at other locations as well.
Fig. 3: Validation of wave parameters Off Vijayadurg @17m water depth
The simulated Tz is in general underestimated and the Mdir also differs from that of observations for non-monsoon season. The simulated Tz and Mdir are in better agreement during southwest monsoon, which is again observed at most validation locations. The domination of sea waves could be the reason behind better agreement in direction and period during southwest monsoon.

Fig. 4: Validation of wave parameters Off Cuddalore at 30m water depth
Again one year data measured off CuddaloreTamilNadu at 30m water depth during the year 2010 is presented as a case study for locations in BoB (Fig. 4). The seasonal variability and high frequency fluctuations are well captured in this location as well. However the model results of Hs exhibit less agreement compared to that of AS. It is also observed that the model results are slightly over estimated for Hs less than 1m and underestimated the stronger waves. The Tz agrees well with the observations except for the underestimation corresponding to the period of overestimation of Hs. The Mdir is in good agreement with the observations and the seasonal variability is well captured. It is observed that the Hs exhibits good agreement with the observations with a correlation coefficient of more than 0.75 at most of the locations. The detailed analysis revealed that the Hs is in better agreement for lesser wave height than that of strong sea conditions. The model results also exhibited slightly higher values for AS than that of BoB. The simulated Tz well exhibits the spatial and temporal variability in Indian Seas. However it is observed that the simulated period is slightly underestimated at all shallow water locations of validation. The reason for underestimation could be due to the limited extent of southern boundary (40degS) of the model domain. The wave direction is in good agreement and the intra-annual variability is well depicted at all locations.
DATA PROCESSING AND ANALYSIS
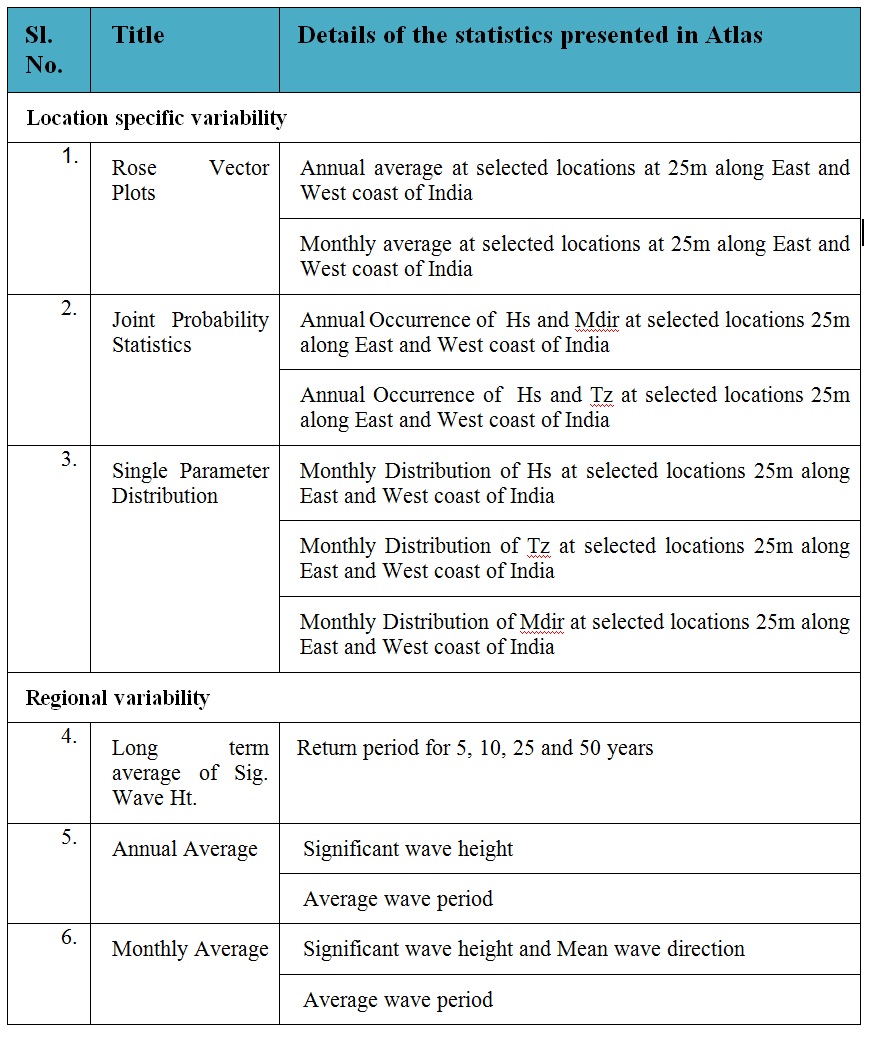
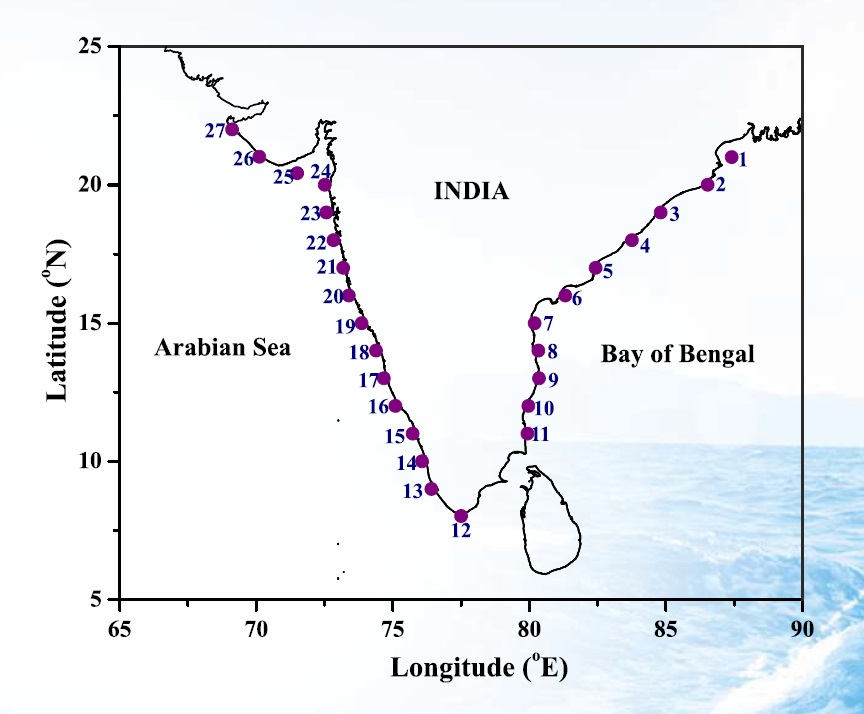
The model results are available in *.dfsu (MIKE21 format) for the period 01 January 1998 to 31 December 2012 at every six hour interval. The dataset is converted to Gridded ASCII using MIKE21 processing tools (Mike Grid Editor) covering an area of 25x25 degree (Lat:6590oE, Long:025oN). The gridded data are available at a grid size of 0.1x0.1degree (250x250 elements) at every six hour interval. The data set is limited up to a water depth of 10m considering the coarse bathymetry and its effect on model results at very shallow waters. The Palk Strait and Lakshadweep and Male islands are blanked due to same reason. The Andaman Islands are not included in the present report due to the unavailability of high resolution bathymetry and lack of measurements to validate the model results. However the Andaman Islands and the Lakshadweep Islands are planned to be incorporated in the next revision of the wave atlas. Averaging the gridded data set is carried out by pooling the data at every element for the reporting period. The annual, monthly and the average of the entire reporting period (15years) are saved separately over the same grid in GrADS (Grid Analysis and Display System) compatible *.grd format. These data sets are utilized for preparing the contour plots in GrADS. The Fortran coding is used for processing the data sets. The detailed statistics are provided in the hardcopy version of Atlas at twenty seven locations extracted at one degree interval at 25m water depth along the costal belt of Indian mainland. The locations are numbered in sequence from Long:87.4degE, Lat:21.0degN in clockwise direction ending at Long:69.13degE, Lat:22.0degN. The extraction is carried out with a search radius of 0.09degree using inverse distance weighted interpolation scheme. The annual and monthly data statistics are computed and presented as rose plots, monthly distributions and joint distribution tables.
Computation of Long term average of Significant Wave Height
The computation of long term average of significant wave height is carried out using the method of Weibul Analysis. The formula of the three parameter distribution is given below:
P=1-exp[-((H-¡)/b)a]
where P is the probability of non exceedance (P=1-Q), a is the shape parameter, ¡ is the location parameter and b is the scale parameter. After taking the logarithm on both sides the equation becomes
[ln(1/Q)]1/a = (1/b)H-(¡/b)
The [ln(1/Q)]1/a is called the reduced variate of Weibull distribution. A best line fit is made using the least square method and the values of b and ¡ are obtained from the slope and intercept of the best line fit. The shape parameter which varies between 0.8 and 1.3 with an increment of 0.05 is selected from the best line fit which gives the highest value of correlation coefficient.
The gridded wind data utilized for model input has undergone significant spatial and temporal smoothing which removes the extremes in the wind data. The absence of extremes in input wind forcing lead to underestimated wave heights during extreme weather which in turn gets reflected in computation of long term average of significant wave height. It is observed that the estimated values of long term average of significant wave height is less than that computed after incorporating the extreme observations/cyclone passages.
Coastal and Environmental Engineering
Coastal
and Environmental engineering (CEE) group focuses primarily on carrying out
research on the coastal processes, issues pertaining to engineering along the
coastline and coastal environmental quality. CEE has undertaken two major plan
projects viz., Shoreline management and Technical criteria atlas and a
component of Ocean observation, the HF Radar network under the XII plan. Major
projects of national importance undertaken by the group include seabed investigation
engineering and model studies for development of Gulf of Khambat
(Project Kalpasar) and Engineering feasibility and
Environmental Impact Assessment studies for marine coal handling facility off Cheyyur, Tamilnadu. The group has
the credit of working on World Bank projects viz., Waste load allocation and
assimilation capacity, State wide environmental action plan for various states,
development of guidelines for EIAs of infrastructure development; European
Union funded project on assessment of impacts of Tributlytin
(TBT) on multiple coastal uses, stabilisation of Haldia channel etc.
CEE
group is at the forefront of coastal related research and development compared
to traditional coastal engineering institutions due to the ability to integrate
field investigations, mathematical modeling studies, engineering solutions and
field execution tailored to site-specific requirements; all under one roof. The
group has primarily concentrated in evolving areas where research input is
higher. This can be clearly seen from the different types of projects handled
over the years which have resulted in accumulation of a spectrum of data bank
covering almost the entire coastline of the mainland and the islands of Andaman
and Nicobar and Lakshadweep. A large number of case studies have been
undertaken along the entire coastline for validation of model studies and
corroborated using field data. Significant contribution to society and industry
by the CEE group is by providing technical support for ports and harbours, erosion mitigation studies; fisheries harbour
development, navigation and allied activities.
Areas of expertise include detailed engineering designs for intakes and
outfalls, breakwaters, dredgeability and disposal studies,
configuration of dam alignment based on engineering, geophysical studies and
geological site setting, comprehensive and rapid environmental impact
assessment for coastal infrastructure and Risk Assessment (RA) studies for
hazardous cargo handling.
Field
observations form the crux of the data collection
program to create baseline data with site specific information. Collection of
data using internationally acceptable standard procedures/methods and
transformation of raw data to usable information are the strengths of the group
which has enabled providing engineering solutions. The number of parameters
measured at each site varies from 13 to 100 at places. CEE group has state of
the art infrastructure for measurement of geotechnical, oceanographic, ecological
and allied environmental laboratories. To cater the computational requirements numerical
modelling and statistical analysis a high performance cluster has been setup by
the group. Laboratory analysis is carried out generally as per Indian Standards
(BIS) and according to international standards in absence of national code. Also
code of practice was developed in-house for surveys, measurement and geosynthetics design in the coastal zone. The group has
reviewed BIS, PIANC standards for latest updates in the field of coastal
engineering. CEE is entrusted by Ministry of Environment, Forest and Climate
Change (MoEF&CC) to undertake HTL/LTL mapping to
complex CRZ demarcation on the cartographic front.
Data
collection in the coastal zone, unlike a ship borne cruise involves risks of
operating in the surf and wave breaker zones, patience, extensive walking and
keen observation. Beach profiles generally would need 3 persons to cover 2.5kms
a day, at a resolution for CRZ mapping. Establishing local bench marks with a
GPS observation is a rigorous exercise that the group undertakes. Bathymetry
surveys are usually fast with coverage up to 20 line km a day, provided tide
and met-ocean weather cooperates. Water quality and sediment observations
require extensive laboratory work. Although remote sensing is progressing
towards utility, yet it needs ground truth and often a greater detail is
essential for development projects. Overall, for carrying out studies for a 20
km stretch, at least 15 - 20 technical person are required. Moreover deployment
of near-shore observations has its own share of issues, - Vandalism, water
seepage, buried instruments etc. Against all the odds, CEE group has managed to
recover 85-90% data in all the projects well in par with international
standards. This essentially translates to 40% of time in a year at site, for
two seasons. CEE at NIOT is progressing towards an integrated approach for
handling datasets. CEE has been progressing towards near shore and surf zone
technologies which are still in development stages internationally.
Since
the inception the group is involved in modeling of various coastal processes
such as shoreline changes, dredge dump disposal, tranquility, advection
dispersion, siltation, storm surge, wave transformation etc. Numerical model
studies carried out for project Kalpasar is a
landmark achievement of the group. The group has published the NIOT Wave Atlas
for the coast of India after two decades since the first wave atlas for Indian
coast was published. CEE has the expertise of using numerical models such as
Delft-3D, MIKE, ADCIRC, SWAN, SWASH for coastal processes and specific packages
like PHAST (for hazardous cargo quantitative risk assessment) and CORMIX (for
dispersion studies and outfall design)
CEE
group has provided expertise for engineering and design to Port Trusts,
Fisheries Department, Public Works Departments, Tourism Department's, local
bodies of state and central government. For the first time in India,
indigenously designed and developed suction pile was installed by the members
of the group. The group is also demonstrating an indigenously designed unique
shore protection scheme using geosynthetic tubes at Kadalur Periya Kuppam as part of Ministry of Earth Sciences Shoreline
Management project. The project aims at protecting the fish landing centers and
fishing hamlets in a natural and sustainable manner without affecting the
livelihood and adjacent shorelines.
As
part of the EIA sustainable environmental friendly designs have been
incorporated in the project inception stage itself. Model studies have been
carried out for consequences of handling hazardous cargo and analysis,
prediction and design of brine/heated aqueous discharges into water bodies.
The
group is a mix of technical personnel with experience, mettle and energy. Present
day seniors have seen the transformation of coastal engineering in the past 20
years and have the hands-on experience and competence of carrying out challenging
projects under the guidance of veterans in the coastal engineering field.
Juniors have undergone meticulous training and requisite energy and are capable
of enduring longer data collection programmes. An archive of 250 project reports
provides proof of multi-disciplinary works undertaken. The proposals submitted
to various state governments and industrial sector are competitive with market
and personnel undertaking work scoping are adept with the future technologies. Project
reports are vetted by third party contemporaries in the field. Observations have
been documented and published in reputed journals for public access. Training to
government departments and industry has been provided and student internships /
projects are undertaken to disseminate the knowledge. Following is the summary
of communications made:
|
Workshops
conducted |
09 |
|
Conference
Publications |
62 |
|
Journals |
35 |
|
Technical
reports |
214 |
|
Training
Programs Organized |
09 |
|
Invited
Lectures |
30 |
CEE
group research focuses in creeks, estuaries, nearshore
and coastal areas which are zones extensively utilized by the coastal
communities, fisheries and marine industry. The groups ability to develop
application-oriented technology and conduct scientific research in the marine sector
thus contributes to sustainable coastal infrastructure development of the
nation.
Under
the plan projects shoreline response studies have been carried out all along
the Tamilnadu coast and priority sites in other
states like Uppada in Andhra Pradesh, Querim beach in Goa. For developing Technical Criteria
Atlas field data has been collected all along the Indian coastline. Comprehensive water quality monitoring and
biological studies have been carried out
in the open coasts with focus on polluted areas like Ennore
& Thane Creeks, Hugli estuary etc. Field data collection has been carried
out primarily for calibration of the mathematical model studies and detailed
engineering design. These studies have enabled thorough understanding of the
coastal processes, shoreline behaviour and response to coastal protection
structures, water quality issues in the nearshore,
estuarine and creek waters, biological phenomena etc. thus developing the
competence, capability and confidence of the group with respect to coastal
engineering.
Coastal and Environmental Engineering

Dr. Basanta Kumar Jena
Scientist-G, Project Director,
Coastal and Environmental Engineering,
NATIONAL INSTITUTE OF OCEAN TECHNOLOGY,
Velacherry-Tambaram Main Road,
Narayanapuram, Pallikaranai,
Chennai - 600 100,
Tamil Nadu, INDIA.
Phone: 044-66783468
email: bkjena.niot@gov.in
Project Investigator
Dr. B.K.Jena
Dr. K.M. Siva Kholundu
Dr. Jossia